Open Access
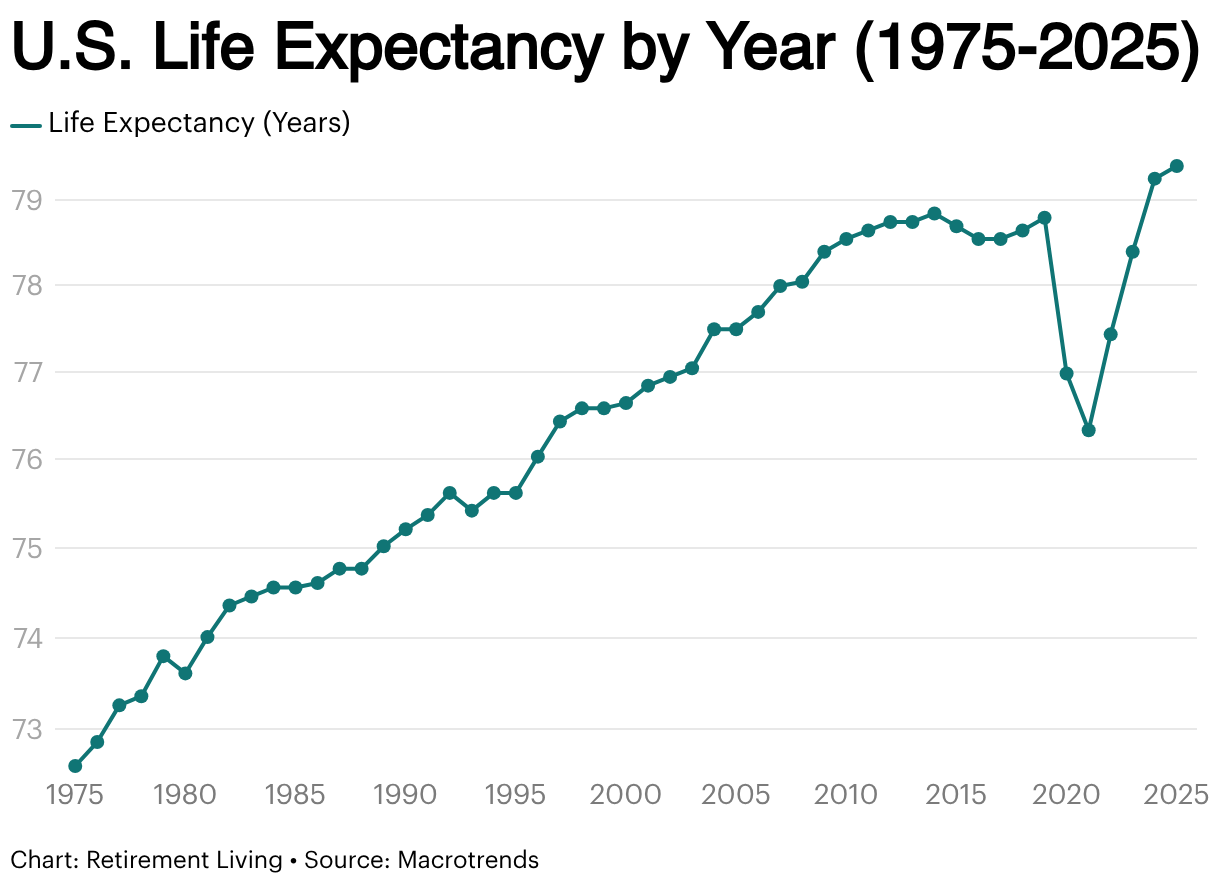
Life expectancy at birth in the U.S. reached 79.4 years in 2025, up from 76.33 years in 2021 during the COVID-19 pandemic. This marks the highest level recorded in the United States.
According to the latest report from the Centers for Disease Control and Prevention, male life expectancy rose from 74.8 to 75.8 between 2022 and 2023, while female life expectancy increased from 80.2 to 81.1. Age-adjusted death rates also fell from 751 per 100,000 in 2023 to 722 in 2024.

Key Insights
U.S. life expectancy reached a record 79.4 years in 2025, fully recovering from the pandemic-era decline.
↓ Jump to insight
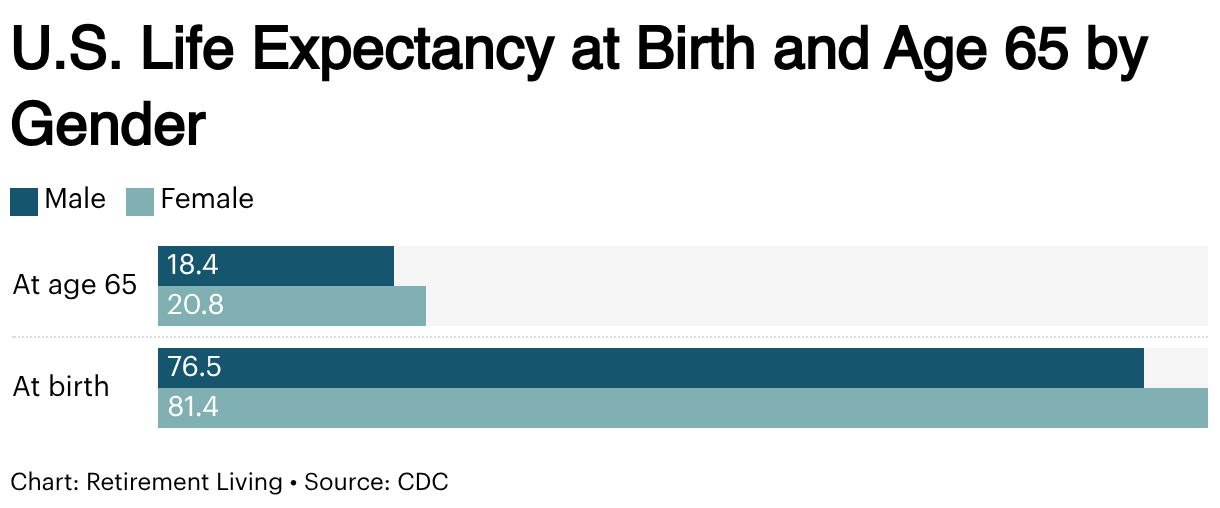
Women continue to outlive men, and Americans who reach 65 can expect nearly two more decades of life on average.
↓ Jump to insight
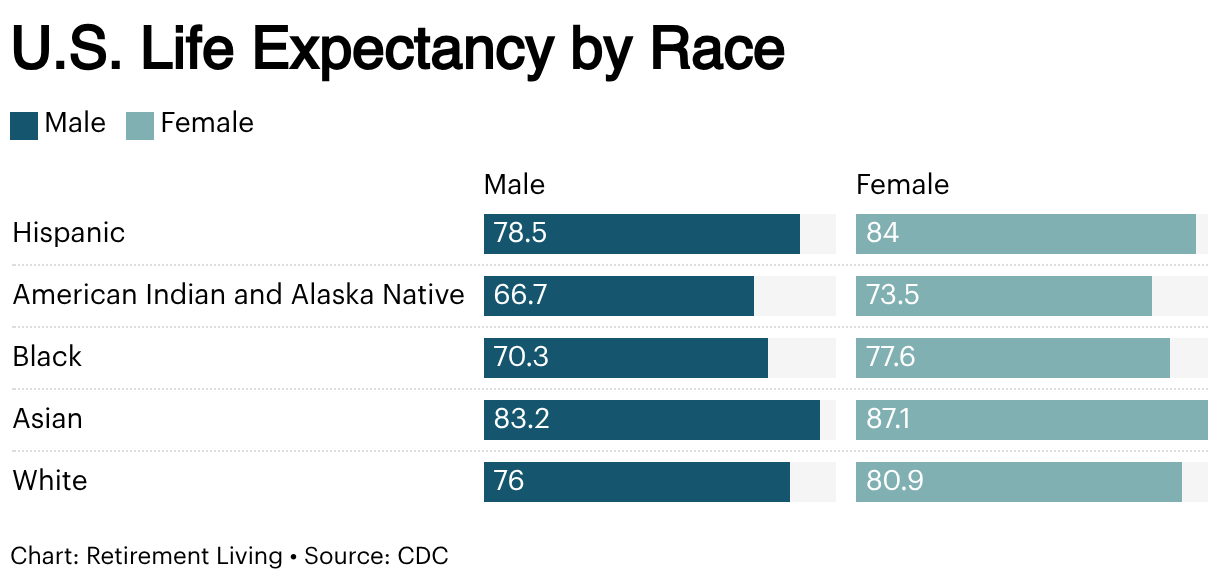
Life expectancy ranges widely by race, from 85.2 years among Asians to 70.1 years among American Indian and Alaska Native populations.
↓ Jump to insight
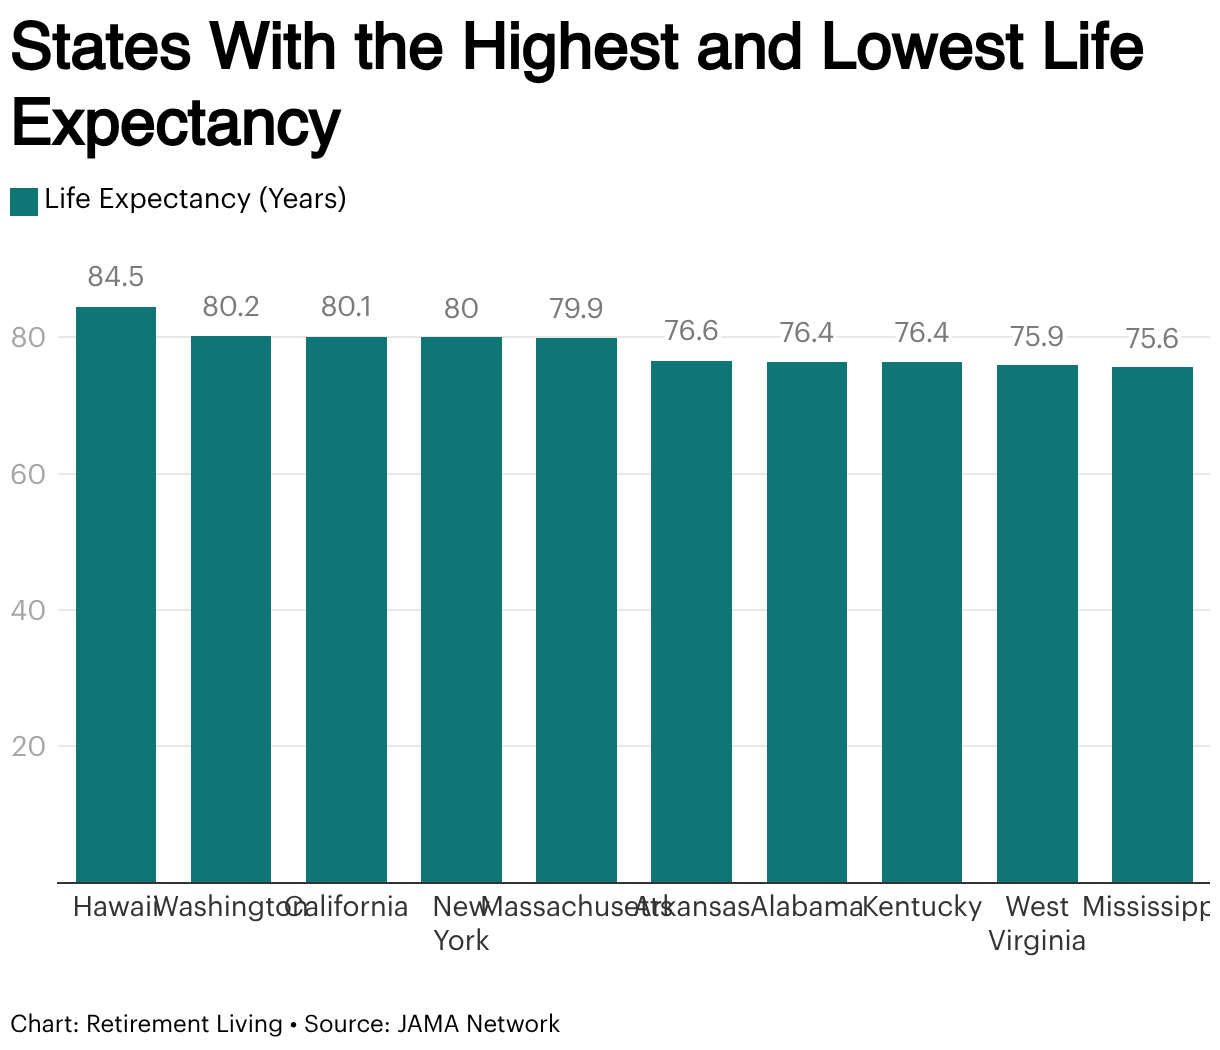
Western and Northeastern states report the highest life expectancy, while several Southern states rank at the bottom.
↓ Jump to insight
Heart disease remains the top cause of death, and the ten leading causes account for about 71% of all U.S. deaths.
↓ Jump to insight
What Is the Current U.S. Life Expectancy?
U.S. life expectancy at birth stands at 79.4 years in 2025, based on the latest federal life expectancy estimates. That surpasses the 2019 level of 78.79 years and reflects steady gains since 2022.
U.S. Life Expectancy by Gender and Age
Women continue to live longer than men across most demographic groups in the United States. In 2024, life expectancy at birth reached 79.0 years for the total population, up from 78.4 in 2023.
At age 65, Americans can expect about 19.7 more years of life, on average. Women aged 65 can expect 20.8 additional years, compared to 18.4 years for men. These longer lifespans help explain why older adults consider the benefits of aging in place when planning for retirement and long-term care.
U.S. Life Expectancy by Race
According to the CDC’s latest report, Asians have the highest life expectancy at 85.2 years. Hispanics follow at 81.3 years. White Americans average 78.4 years, Black Americans 74.0 years, and American Indian and Alaska Native populations 70.1 years.
U.S. Life Expectancy by State
Life expectancy in the U.S. varies by state and region, which often aligns with broader patterns seen in the best and worst states for senior care.
States in the West and Northeast rank higher, while many Southern states rank lower:
- Hawaii, Washington, California, New York, and Massachusetts rank among the states with the highest life expectancy.
- Mississippi, West Virginia, Alabama, Kentucky, and Arkansas rank among the states with the lowest life expectancy.
Leading Causes of Death in the U.S.
According to the National Center for Health Statistics (NCHS), heart disease remains the leading cause of death in the United States, followed by cancer and unintentional injuries. These ten leading causes account for about 71% of all deaths nationwide.
These trends matter for older adults planning for aging in place, as chronic conditions such as heart disease and Alzheimer disease often shape long-term care needs.

Life Expectancy Statistics by Country
According to United Nations world population data, life expectancy varies widely across countries based in part on access to healthcare. Several small European and Asian nations report the highest average lifespan, with Monaco, San Marino, Hong Kong, and Japan ranking at the top globally.

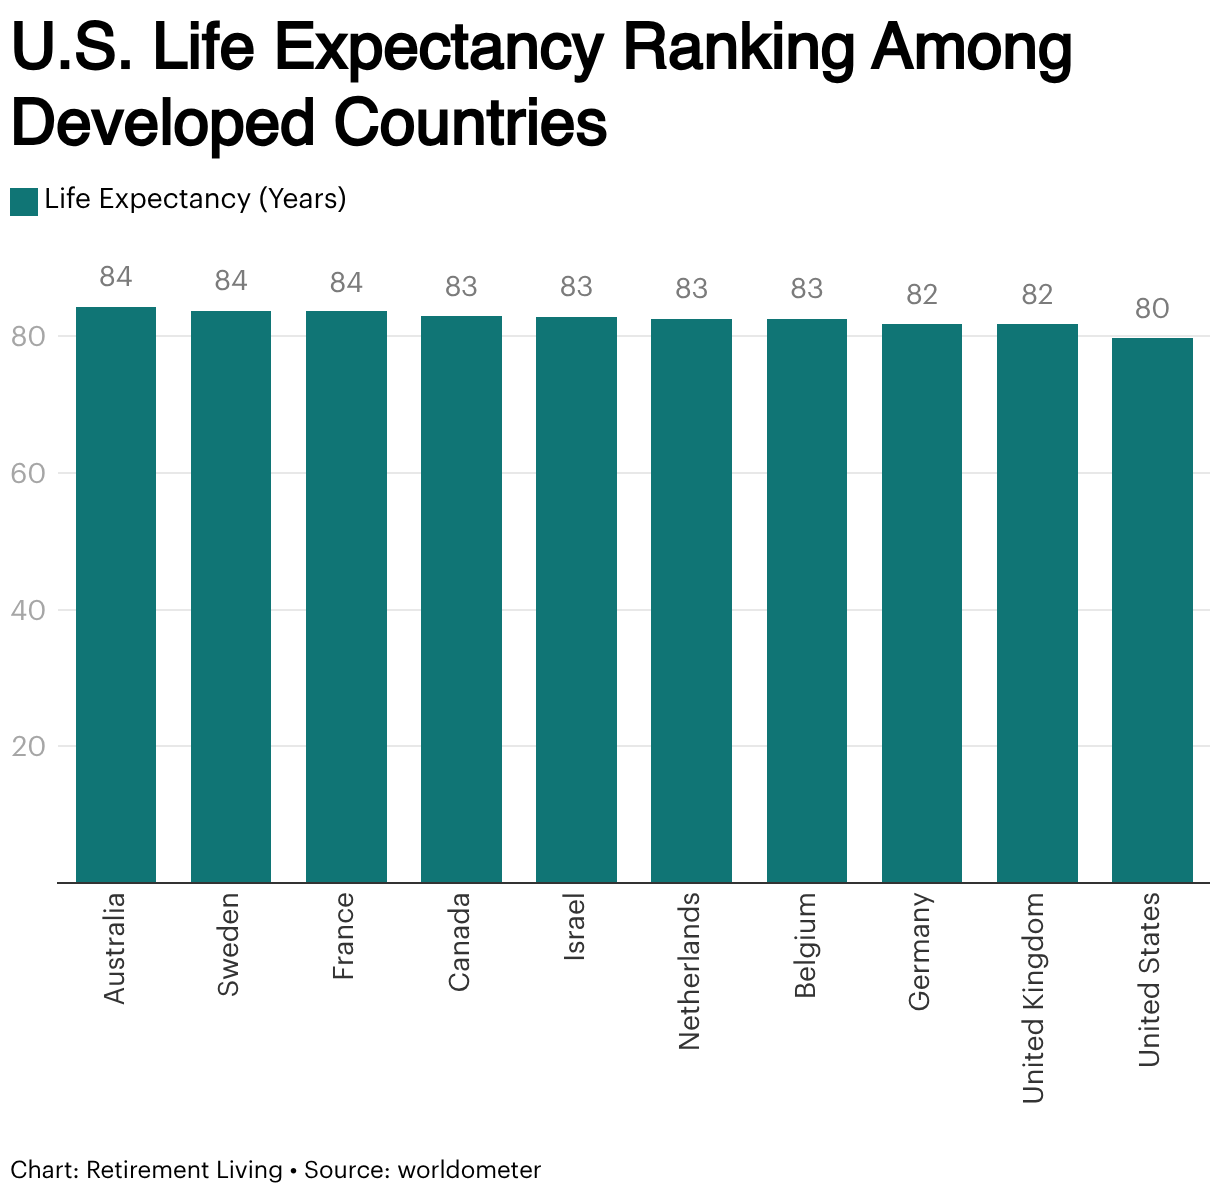
How the U.S. Compares to Other Developed Countries
The United States ranks around 61st globally in life expectancy. Many other developed countries rank higher, including Australia, Canada, Sweden, France, Israel, the Netherlands, Belgium, Germany, and the United Kingdom.
What Percentage of People Live to 90 or 95?
About 76% of adults say they want to live to at least age 80, and nearly 29% hope to reach 100. On average, Americans say they would like to live to age 91.
Actuarial data show that a 65-year-old woman has about a 40% chance of reaching age 90. A 65-year-old man has about a 30% chance of reaching 90. Women also have higher odds of living to 95.
Even with these probabilities, many Americans underestimate their lifespan and often believe they will die younger than data suggest. These longer lifespans can affect retirement planning, including decisions about assisted living and long-term care.
Bottom Line
Life expectancy continues to improve across most age groups, but healthy life expectancy remains just as important. The infant mortality rate is now 552.5 deaths per 100,000 live births. The ten leading causes of infant death accounted for 65.8% of all infant deaths, including congenital malformations, low birth weight, and sudden infant death syndrome.
Life expectancy also rises with age. While life expectancy at birth is about 79 years, Americans who reach age 65 can expect to live about 19 to 20 more years, into their mid-80s. Over time, improvements in survival at both early and older ages have helped increase overall life expectancy in the United States.
Fair Use Statement
If you have practical insight or personal experience related to aging in place, you can share it with us at [email protected]. Any personal information shared will remain confidential.
Sources
- CDC – Mortality in the United States (Evaluated 19 February 2026)
Link Here - JAMA – All-Cause Mortality and Life Expectancy by Birth Cohort Across U.S. States (Evaluated 19 February 2026)
Link Here - National Vital Statistics Reports – United States Life Tables (Evaluated 19 February 2026)
Link Here - Pew Research Center – How Americans Are Thinking About Aging (Evaluated 19 February 2026)
Link Here - JAMA – U.S. Life Expectancy Is Rebounding (Evaluated 19 February 2026)
Link Here - Scientific American – U.S. Life Expectancy Hits All-Time High (Evaluated 19 February 2026)
Link Here - Johns Hopkins – New Report: Life Expectancy Years Shorter in the United States Compared to the United Kingdom (Evaluated 19 February 2026)
Link Here - Health System Tracker – How Does U.S. Life Expectancy Compare to Other Countries? (Evaluated 19 February 2026)
Link Here