Open Access
For those needing long-term care or assistance with activities of daily living (ADLs), moving into a skilled nursing facility, nursing home, or other residential care community may be necessary. As of 2024, there are around 15,300 nursing homes with 1.6 million licensed beds in the U.S.
Families seeking help to care for their loved ones have to weigh several factors when picking one of these facilities, which can vary significantly by size and may be quite costly.
Here’s a detailed look into nursing home statistics.

Key Insights
Nursing homes in the U.S. can cost between $8,000 and $9,700, depending on accommodation type, state, and level of assistance needed.
↓ Jump to insight
Over the past eight years, the number of residents living in nursing facilities decreased by 12%, from nearly 1.4 million in mid-2015 to 1.3 million in mid-2023.
↓ Jump to insight
California and New York have the most nursing homes, while Alaska has the least facilities in the U.S.
↓ Jump to insight
There are nearly 1.4 million workers employed by nursing care facilities as of May 2024.
↓ Jump to insight
In 2020, more than 63% of nursing home residents were women
↓ Jump to insight
Nursing Home Statistics
While the number of nursing homes and residents living in such facilities has steadily declined over the past two decades, the COVID-19 pandemic drove these numbers down further. As of May 2024, more than 171,000 nursing home residents died from COVID-19.
As of 2024, there are fewer nursing homes than at any other point in the past nearly30 years. While the declines have dampened the growth of the nursing facility market, revenues for these facilities are expected to rise in the coming years as the senior population in the U.S. grows.
Medicaid Coverage in Nursing Homes
Government benefits in the U.S significantly support the costs for affording nursing homes.
- More than 6 in 10 nursing home residents were Medicaid recipients in 2020.
- Medicaid reimburses only about 82% of the actual costs for 40% of nursing homes.
- As of 2023, approximately 62% of nursing home residents were enrolled in Medicaid.
Most senior residents also rely on long-term care insurance (LTCI) to afford the high costs of nursing home facilities. Experts recommend purchasing LTCI between the ages of 50 and 65 to secure lower premiums and ensure coverage eligibility before health issues arise.
Types of Residential Care Facilities
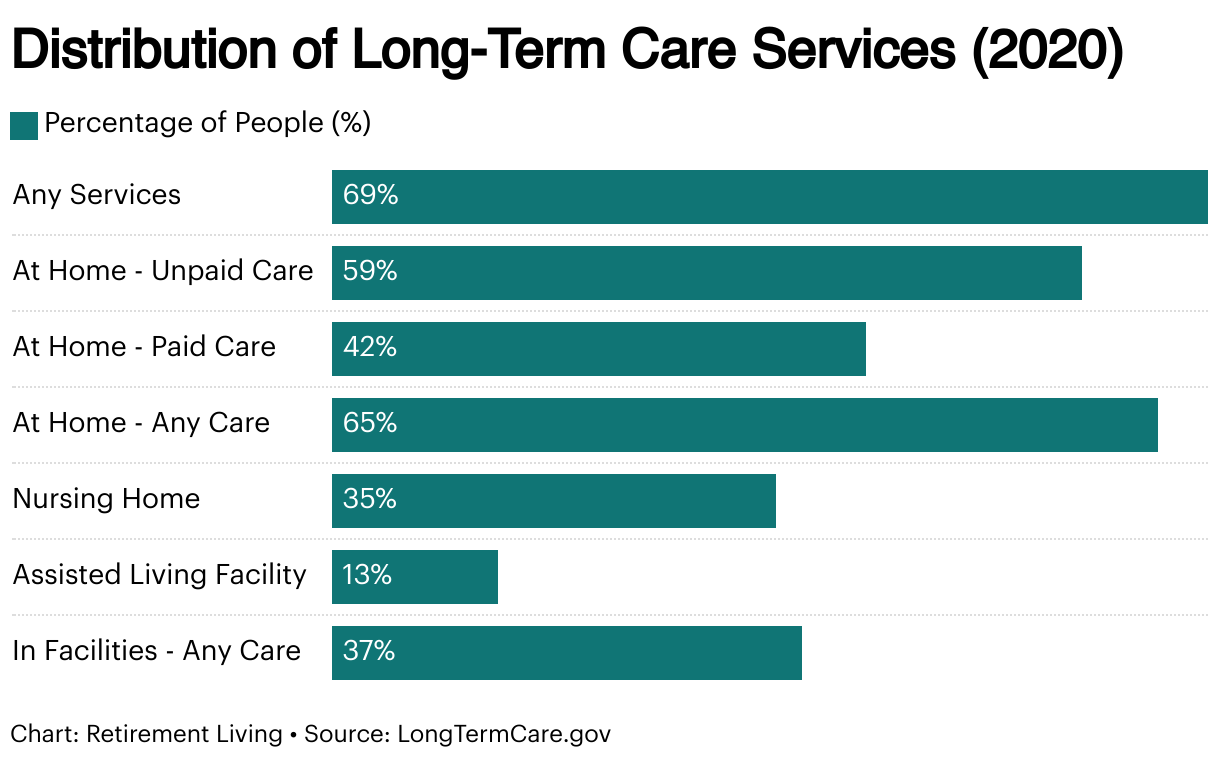
According to the National Center for Health Statistics report from 2022, most long-term care service users were aged 65 or older, 83.1% being nursing home residents.
For older adults seeking long-term care, there are several options for housing and care depending on their needs.
Nursing homes: Provide a wide range of personal and medical services, typically including nursing care, 24-hour supervision, meals, and rehabilitation services in some cases. These facilities, sometimes called skilled nursing facilities, are typically licensed and inspected and may be better suited for people with chronic or physical or mental health conditions.
While they may be described interchangeably, skilled nursing facilities may be separate from nursing homes, as they include care administered by trained registered nurses under a doctor’s supervision.
Board and care homes: Also called residential care facilities, these are typically smaller homes where residents receive personal care and meals but not nursing and medical care.
Assisted living facilities: Can offer residents help with their daily personal care, but typically not to the same extent as nursing homes.
Continuing care retirement communities: Offer tiered services where residents can move from independent housing to assisted living and skilled nursing care facilities, depending on their needs.
Disabled Older Adults in Nursing Home Statistics
Older adults aged 65 or above are highly likely to develop a disability due to various factors. Here are some statistics on disabled older adults in nursing homes:
- A study found that nearly 90% of nursing home residents have a recorded disability, compared to less than 30% of older adults living in the community.
- Nursing home residents have an average of 4.5 disabilities, which can include hearing and visual impairments, as well as difficulties with memory and concentration
- A 2020 study showed 49% of seniors aged 85 or above entering nursing homes had severe disabilities prior to relocation. This number increases significantly after entry, with 89% of nursing home residents classified as severely disabled shortly after moving in.
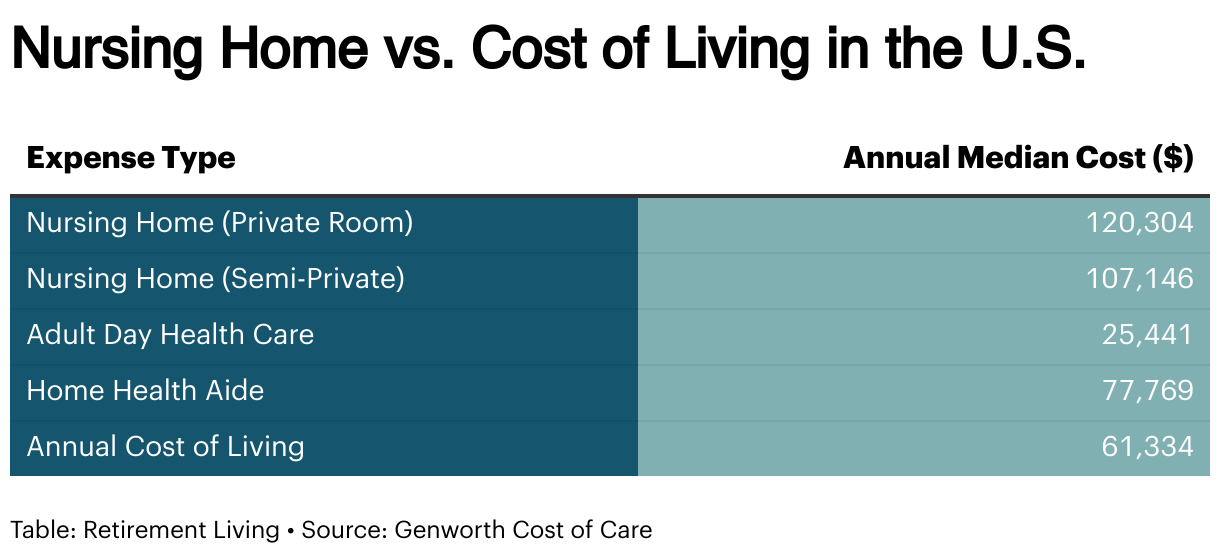
Nursing Home Costs Vs. Cost of Living
Nursing homes in America can cost a monthly median average of $9,700 for a private room and $8,600 for a shared room, according to the Genworth Cost of Care Survey.
Nursing home costs often surpass the general cost of living, covering expenses like room, board, and medical care. With residents staying an average of 13.7 months before passing away, these fees can strain household budgets, especially considering regional differences and the limited coverage provided by long-term care insurance or Medicaid. Here’s a comparison chart by annual costs in the U.S. to highlight these differences.
Nursing Home Populations
Since the turn of the century, the number of residents in certified nursing homes has declined significantly, from 1.48 million in 2000 to 1.37 million in 2015 to just 1.2 million in 2023. The nursing home population has been further driven down in recent years, with more than 171,000 nursing home deaths attributed to COVID-19.
The declining number of people living in nursing homes reflects a trend of more people opting to receive care in home- and community-based settings rather than institutional settings. People are instead relying on personal home aides, which can cost significantly less than paying for a private or semi-private room at a nursing home.
The decline also bucks overall population trends in the U.S. While fewer people have entered nursing homes, the share of Americans ages 65 and older has grown from 12.3% in 2000 to 17.1% in 2022.
As of 2024, 4.5% of American seniors aged 65 or older reside in long-term care facilities, including nursing homes, according to the Centers for Disease Control and Prevention (CDC).
Nursing Home Residents by State
California and New York had the most nursing homes in 2023, with nearly 100,000 apiece, while Alaska was the only state with fewer than 1,000 in 2023.
Certified Nursing Home Facilities by Year
As the number of people living in nursing homes has declined by year, so has the number of facilities certified as nursing homes.
In 2000, the U.S. had nearly 17,000 nursing homes. In 2023, that number had fallen to 15,000.
According to The American Health Care Association and National Center for Assisted Living 2024 report, 774 nursing homes have permanently shut down since February 2020, leading to the displacement of 28,421 residents. The report also estimates that 290,624 more seniors could be at risk of displacement in the near future.
The report has attributed the decline, in part, to labor shortages, with nursing homes losing skilled workers during the pandemic. As of 2024, 20% of nursing homes have reduced their capacity by closing units, wings, or entire floors.
Nursing Home Resident Demographics
The largest share of nursing home residents by age are those 85 and older, who made up nearly 33% of residents in 2020. Among roughly 1.3 million nursing home users, the next largest groups were ages 75 to 84 (27%) and 65 to 74 (22%).
Nearly half of nursing home residents (46%) were diagnosed with Alzheimer’s disease or another form of dementia, a reflection of these patients’ need for more around-the-clock care than other seniors.
Nursing home residents were also predominantly white and women. Nearly 75.1% of residents in 2020 identified as non-Hispanic white, followed by 14.3% identifying as Black. And while women and men make up more even shares of the overall U.S. population, more than 63.3% of nursing home residents were women in 2020.
Nursing Home Age Groups
The number of Americans aged 65 and older is projected to increase from 58 million in 2022 to 82 million by 2050, a 47% increase. The share of the 65-and-older age group in the total population is projected to rise from 17% in 2022 to 23% by 2050.
Between 1980 and 2022, the median age of the U.S. population increased from 30.0 to 38.9 years. In 2022, one-third of U.S. states had a median age above 40, with Maine (44.8) and New Hampshire (43.3) having the highest median ages.
Nursing Home Employment
There were nearly 1.4 million workers employed by nursing care facilities as of May 2023.
Most of these workers were home health and personal care aides, with more than 509,000 people employed in these positions. According to the ACHA 2024 report, 458,590 nurse aides were employed in U.S. nursing homes as of 2023.
The median hourly pay for nursing facility workers was $20.25, below the median wage for all jobs nationally ($23.11 per hour). The typical pay for aides and nursing assistants was even lower at just $18.06 per hour. As of 2024, the average hourly pay for nursing care providers in a nursing home is between $34 and $36.
Pay for skilled nurses at these facilities was significantly higher, with registered nurses receiving a median pay of more than $38 per hour. Nursing assistants typically earn significantly less than registered nurses.
According to ACHA, 30% of nursing homes meet or exceed the 2.45 hours per resident day (HPRD) requirement for nurse aides.
Caregiving in Nursing Home
A study by JAMA Network found that most seniors rely on unpaid caregivers before entering nursing homes, receiving an average of 27 hours of care weekly. Only 33% have paid caregivers, reflecting the high expenditure families face.
Paid caregiving costs about $3,134 monthly, often leading families to choose long-term care facilities as care needs grow.
Nursing Home Market Outlook
While the declining number of people at nursing homes coupled with the COVID-19 pandemic dampened the market for skilled nursing facilities in the U.S., the market remains robust, with a value of $179 billion in 2022.
However, as the share of Americans ages 65 and older has risen, the market for nursing facilities is predicted to grow at an annual growth rate (CAGR) of 3.43% between 2023 and 2030. The prevalence of chronic diseases, including heart conditions, dementia, and Alzheimer’s disease, is also expected to contribute to the demand for such facilities.
Still, the hit to the market and declining use of skilled nursing facilities caused by the pandemic may have lasting impacts on the market for nursing facilities as more people turn to at-home care.
FAQs
While there have been upward of 1.2 million people living in nursing homes for decades, relatively few of the overall U.S. population rely on these facilities. In 2020, there were less than 1.1 million people ages 65 and older living in nursing facilities, accounting for about 2% of the population of Americans in that group.
As of July 2024, there were 15,003 certified nursing homes in the U.S., down from nearly 17,000 facilities in 2000.
Women are more likely than men to live in nursing homes, with women making up nearly 62% of nursing home residents in 2020. Nursing home residents are also likely to suffer from a chronic health condition — nearly half of residents in 2020 were diagnosed with dementia or Alzheimer’s disease, while nearly 3 in 4 residents had high blood pressure or hypertension.
People age 85 and older make up the largest share of nursing home residents, representing nearly one-third of the nursing home population in 2020.
The most common disease in nursing homes is high blood pressure, followed by depression, dementia, heart disease, and diabetes. 49% of residents report suffering from depression due to social isolation and loneliness, while 43% suffer some form of dementia, such as Alzheimer’s disease.
Bottom Line
Nursing homes in the U.S. house 1.3 million residents across 15,300 facilities as of 2024, with costs averaging $103,200 annually for private rooms and $93,075 for shared rooms. These costs surpass the annual average cost of living of $61,334. Medicaid supports 62% of residents, but reimburses only 82% of costs, highlighting financial challenges.
Chronic conditions like dementia (affecting 46% of residents) and high blood pressure drive demand, while labor shortages remain a concern, with only 1.4 million workers employed.
According to the Genworth Cost of Care Survey, seven out of ten baby boomers aged 65 will require assistance with personal care by 2030. This shows the increasing future demand for long-term care and facilities.
Fair Use Statement
Feel free to share these findings for noncommercial purposes, but please provide a link back to RetirementLiving.com.
Sources
- Chidambaram, P., & Burns, A. A Look at Nursing Facility Characteristics Between 2015 and 2023. KFF. Evaluated June 4, 2024.
Link Here - NAICS 623100 - Nursing Care Facilities (Skilled Nursing Facilities). U.S. Bureau of Labor Statistics. Evaluated June 4, 2024.
Link Here - COVID-19 Nursing Home Data. Centers for Medicare & Medicaid Services. Evaluated June 4, 2024.
Link Here - Table 92. Nursing homes, beds, residents, and occupancy rates, by state: United States, selected years 1995–2016. U.S. Centers for Disease Control and Prevention, National Center of Health Statistics. Evaluated June 4, 2024.
Link Here - U.S. Skilled Nursing Facility Market Size, Share & Trends Analysis Report By Ownership (For-profit, Non-profit, Government), By Type (Freestanding, Hospital), And Segment Forecasts, 2023 - 2030. Grand View Research. Evaluated June 4, 2024.
Link Here - Data from the 2020 National Post-acute and Long-term Care Study. U.S. Centers for Disease Control and Prevention, National Center of Health Statistics. Evaluated June 4, 2024.
Link Here - Long-Term Care Facilities: Assisted Living, Nursing Homes, and Other Residential Care. National Institute on Aging. Evaluated June 4, 2024.
Link Here
- What's the difference between a skilled nursing facility and a nursing home? United Healthcare. Evaluated June 4, 2024.
Link Here
- Population ages 65 and above for the United States. Federal Reserve Bank of St. Louis. Evaluated June 4, 2024.
Link Here
- New Report Finds Access To Nursing Home Care A Growing Crisis. American Health Care Association and National Center for Assisted Living. Evaluated June 4, 2024.
Link Here
- May 2023 National Occupational Employment and Wage Estimates. U.S. Bureau of Labor Statistics. Evaluated June 4, 2024.
Link Here
- Population Pyramid: Population by Age and Sex. U.S. Census Bureau. Evaluated June 4, 2024.
Link Here
- Janine F.B. ASPE Report: Medicaid Payments to Nursing Homes Average 82% of Costs of Care. LeadingAge.org. Evaluated December 2, 2024.
Link Here
- How Much Care Will You Need? ACL.gov. Evaluated December 2, 2024.
Link Here
- Access to Care Report. American Health Care Association. Evaluated December 2, 2024.
Link Here
- Nurse Staffing Estimates in US Nursing Homes, May 2024. Office of the Assistant Secretary for Planning and Evaluation. U.S. Department of Health and Human Services. Evaluated December 2, 2024.
Link Here - Kenneth L. et al. The Natural History of Disability and Caregiving Before and After Long-Term Care Entry. JAMA Internal Medicine. Evaluated December 2, 2024.
Link Here
- Percentage of residents in nursing homes that had select chronic medical conditions in the U.S. in 2020. CDC.gov. Evaluated December 2, 2024.
Link Here