
What Percentage of the U.S. Population Is Over 65?
Updated:
Retirement Living takes an unbiased approach to our reviews. We may earn money when you click a partner link. Learn More
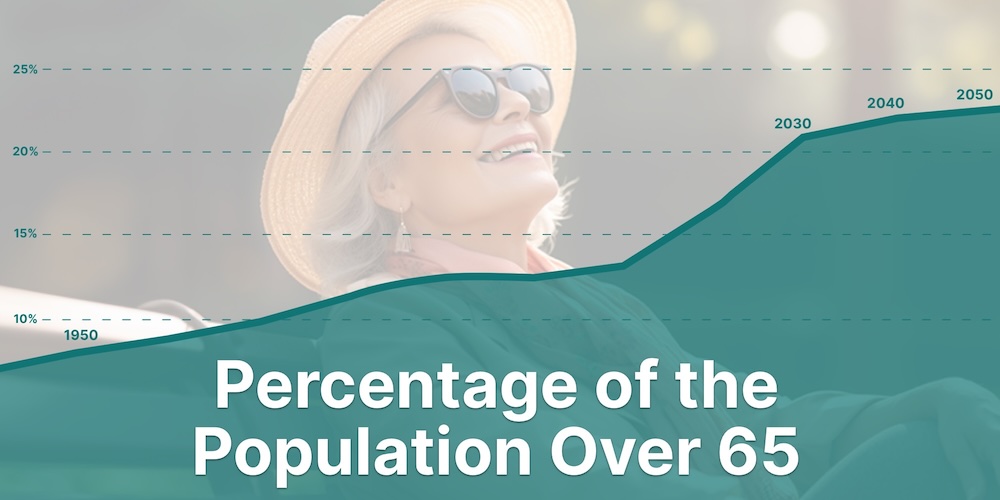
In 1920, less than 5% of people in the U.S. were 65 or older. By 2022, that percentage had grown to 17.3%. While the American population has been aging for decades, the years between 2010 and 2020 posted the largest-ever 10-year numeric gain for those 65 and up, with an increase of 15.5 million people. That’s more than double the next-largest 10-year gain for that age group, which was 5.7 million people between 1980 and 1990.
One of the most important contributors to this trend is the aging of the baby boomer generation, usually defined as Americans born between 1946 and 1964. This cohort began turning 65 in 2011, while its youngest members will turn 65 in 2029.
It’s important to note that the U.S. is not alone in its sizable over-65 population. Among countries with at least one million people, the U.S. ranks only 34th in terms of the percentage of its residents who are 65 and older as of 2020. Japan easily leads the world in this category, as 28.5% of its residents were 65 and older that year.
Key Takeaways:
- America is graying. By 2030, more than 1 in 5 Americans will be over the age of 65.
- The number of Americans over 85 years of age is expected to nearly triple between 2020 and 2060, increasing from 6.7 million to 19 million. The country will also add half a million centenarians over the same period.
- Certain states are more likely to attract and/or keep older adults. Some states, like Maine, have a surprisingly high percentage of residents who are 65 years of age and older.
- American women over 65 significantly outnumber men over 65, though that age disparity is expected to narrow slightly in the future.
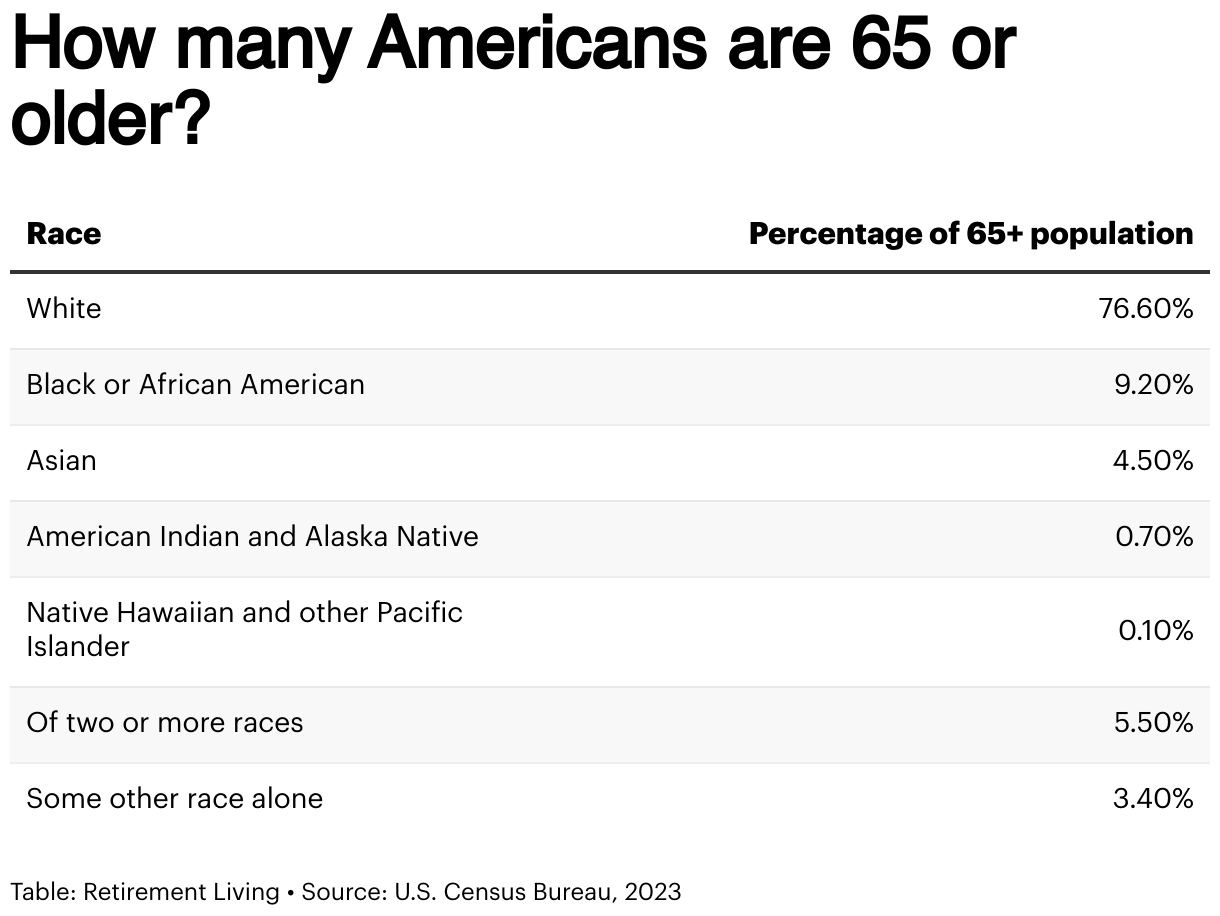
How many Americans are 65 or older?
According to the 2022 American Community Survey, 31,897,671 women and 25,924,644 men were 65 or older. American women aged 65 can expect to outlive American men of the same age by 2.7 more years on average.
The male-to-female ratio for the older population decreases as age increases, meaning there are fewer males per 100 females at older ages than at younger ages. In 2020, the U.S. Census found the following male-to-female ratios for different age groups 65 and older:
Percentages of seniors by state
Maine, Florida, Vermont, West Virginia and Delaware are the states that have the largest percentages of over-65 adults among their residents. In every one of these states, older adults make up more than 20% of the population. By contrast, Colorado, Georgia, Alaska, Texas and Utah have the smallest percentages. In Utah, only 12% of residents are 65 or older.
States with the highest percentages of people over 65:
- Maine: 22.5%
- Florida: 21.6%
- Vermont: 21.6%
- West Virginia: 21.2%
- Delaware: 20.8%
States with the lowest percentages of people over 65:
- Colorado: 15.7%
- Georgia: 15.1%
- Alaska: 13.9%
- Texas: 13.4%
- Utah: 12%
Although Alaska has a very small over-65 population, that segment of the state’s population has grown rapidly, increasing by about 70% between 2010 and 2020. Wyoming’s over-65 community grew by about 44% during that period, making it the state with the second-most rapid growth for this age segment. In third place is New Hampshire, with a growth of about 43%.
The state that had the lowest growth for this age segment over those 10 years was North Dakota, at 11%. No states saw a decline in the number of people over 65 during this period.
States with the highest number of seniors in total
In 2020, 51% of Americans ages 65 and older lived in nine states:
- California (six million)
- Florida (4.6 million)
- Texas (3.9 million)
- New York (3.4 million)
- Pennsylvania (2.4 million)
- Ohio (2.1 million)
- Illinois (2.1 million)
- North Carolina (1.8 million)
- Michigan (1.8 million)
While California has the largest total number of older residents, only 15% of its total population is older than 65. By contrast, Maine’s relatively small number of people over 65 (about 314,000) represents more than 22% of its total population.
Relocation
While seniors are less likely to move than younger Americans, studies nonetheless show that more than three million adults ages 65 and older move every year. Those who are 85 and older are more likely to move than younger seniors; many of these individuals may move for services related to one or more disabilities.7
Florida currently gains more older adults than any other state annually. New York, on the other hand, loses the most seniors each year. Interstate population changes also correlate with the state’s retirement favorability index. According to Retirement Living’s annual report on the best and worst states to retire, Florida ranks as a “best” state while New York is deemed a “worst” state.
Percentage of seniors who work beyond the age of 65
As the average age in the United States has increased over time, so too has the number of older Americans who continue to work.
- In 2021, 18.9% of Americans ages 65 and older — or 10.6 million total — were working or looking for work. Older adults made up 6.6% of the U.S. labor force.
- Between 2000 and 2020, the number of employed workers ages 60 and over doubled among both men and women.
- It is likely that, as the number of people in the U.S. aged 65 and older grows, the older workforce will become more diverse.
Older workers are more likely to be self-employed or work part-time than younger members of the workforce. That likelihood generally increases as workers get older.
Older adults are generally more likely to be employed in positions involving management, service or sales. Unsurprisingly, older adults tend to select less physically demanding work.
Future trends
The makeup of America’s seniors is expected to change in some surprising ways.
Gender
Older women will continue to outnumber older men, though the gender gap will likely narrow with time.
In 2023, the U.S. was home to about 25.9 million men and 31.9 million women over the age of 65, making up about 45% and 55% of the over-65 population, respectively. However, it’s projected that men will make up about 46% of the over-65 population by 2060 and about 47% by 2100.
These changes correlate with a narrowing gap in life expectancy. In 1990, the life expectancy gap between men and women was seven years; by 2017, the gap had narrowed to just five years, reflecting a life expectancy of 76.1 for men and 81.1 for women.
Race and ethnicity
Like other parts of the American population, the older population is becoming more racially and ethnically diverse. Many of the projected racial and ethnic changes among America’s seniors can be attributed to immigration.
Between 2020 and 2040, the number of white Americans ages 65 and older is expected to increase by only 26%. The shares of other racial and ethnic groups within the over-65 sector are expected to see far more substantial increases during that period:
- 148% for Hispanic Americans
- 93% for Asian Americans
- 73% for African Americans
- 58% for American Indians and Alaska Natives
It is projected that by 2060, non-Hispanic whites will make up only 55% of Americans over the age of 65, which will be a drop from 77% in 2018.
What is contributing to the increase in the senior population?
The percentage of Americans ages 65 and older has grown from 4.1% in 1900 to about 17% in 2020. The actual number of adults in that age segment increased from 3.1 million to 55.7 million. At the same time, older adults became older, with the 85+ group increasing from 122,362 to 6.7 million. These changes relate not only to the increase in life expectancy but also to the huge population bubble that was created by the mid-20th century baby boom.
FAQ
What is the largest age group in the United States?
According to the 2020 census, the largest age group in the United States is between 25 and 29 years old.
What share of the population is aged 65 and over?
Those aged 65 and over make up 17.3% of the U.S. population.
Are there more people over 65 years old than under five years old?
Yes. While only 5.6% of Americans are under the age of five, 17.3% are 65 years of age and older.
Sources
- America’s Health Rankings. “Population - Adults Ages 65+ in United States.” America’s Health Rankings. Evaluated Dec. 15, 2023.
- Caplan Z. “2020 Census: 1 in 6 People in the United States Were 65 and Over.” U.S. Census Bureau. Evaluated Dec. 15, 2023.
- Vespa J, Medina L, Armstrong DM. “Demographic Turning Points for the United States: Population Projections for 2020 to 2060.” U.S. Census Bureau. Evaluated Dec. 15, 2023.
- Administration for Community Living. “2021 Profile of Older Americans.” Administration for Community Living. Evaluated Dec. 15, 2023.
- U.S. Census Bureau. “QuickFacts.” U.S. Census Bureau. Evaluated Dec. 15, 2023.
- Kilduff L. “Which U.S. States Have the Oldest Populations?” Population Reference Bureau. Evaluated Dec. 15, 2023.
- National Institute on Aging. “Census Bureau releases report on domestic migration of older Americans.” National Institute on Aging. Evaluated Dec. 15, 2023.
- Mather M, Scommegna P, Kilduff L. “Fact Sheet: Aging in the United States.” Population Reference Bureau. Evaluated Dec. 15, 2023.
- National Library of Medicine. “The Emerging Older Workforce.” National Library of Medicine. Evaluated Dec. 15, 2023.
- U.S. Bureau of Labor Statistics. “Labor Force Statistics from the Current Population Survey.” U.S. Bureau of Labor Statistics. Evaluated Dec. 15, 2023.
- U.S. Census Bureau. “United States.” U.S. Census Bureau. Evaluated Dec. 15, 2023.
- Elflein J. “Life expectancy for men at the age of 65 years in the U.S. from 1960 to 2021.” Statista. Evaluated Dec. 19, 2023.
- Caplan Z, Rabe M. “The Older Population: 2020.” U.S. Census Bureau. Evaluated Dec. 18, 2023.
- U.S. Census Bureau. “2023 National Population Projections Tables: Main Series.” U.S. Census Bureau. Evaluated Dec. 26, 2023.
- Whelan C. “Where Are The Fastest Aging Populations Around The World?” AgingInPlace. Evaluated Dec. 26, 2023.
- U.S. Census Bureau. "American Community Survey." U.S. Census Bureau. Evaluated Jan. 26, 2024.