Open Access
Gold reached an all-time high of $4,827 per ounce in January 2026. It ranked among the best-performing assets for the second year in a row. Central banks supported higher prices by buying 297 tons of gold in 2025, which pushed the value of U.S. gold reserves above $1 trillion. Despite its strong performance, most Americans don’t own any gold. According to Goldman Sachs, gold ETFs accounted for just 0.17% of American portfolios.

Key Insights
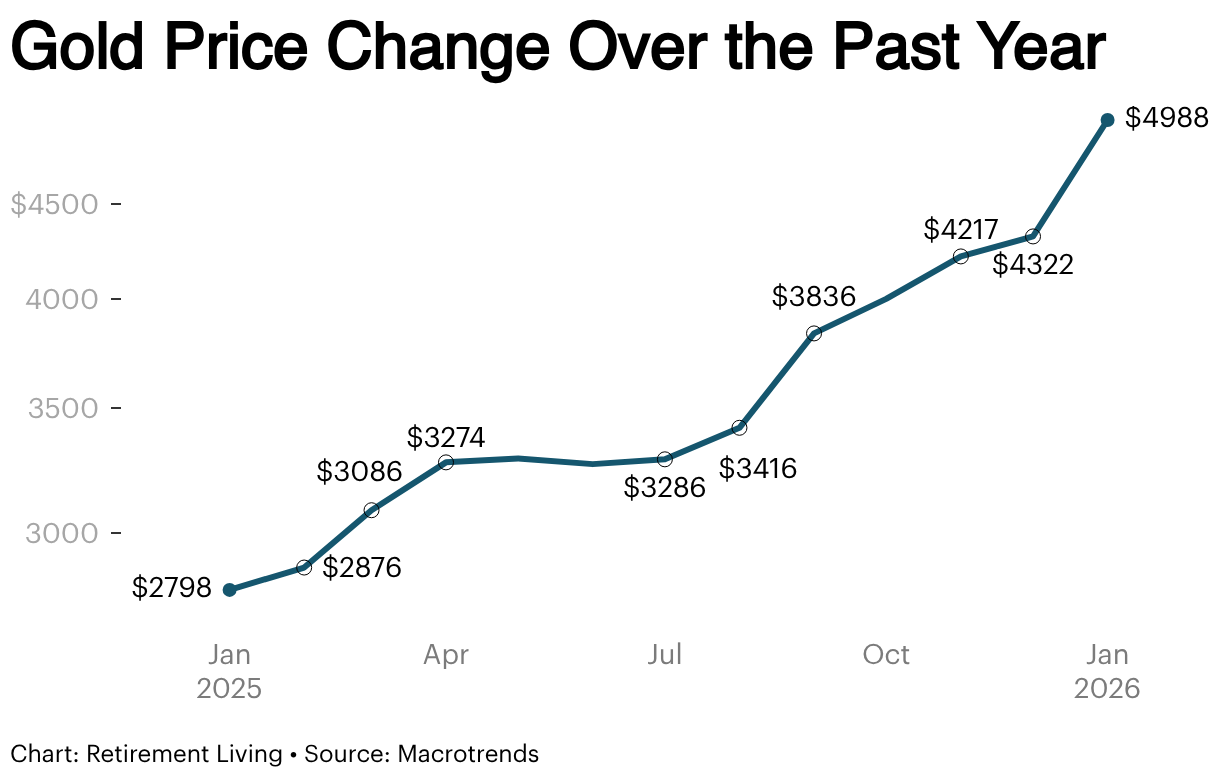
Gold reached a record high of $4,827 per ounce in January 2026, following a 65% price increase over the prior year.
↓ Jump to insight
Over the past century, gold prices have risen by about 23,000%, but long-term average annual returns remain in the single digits.
↓ Jump to insight
Inflation-adjusted gold prices hit their highest level on record by January 2026, driven by inflation cycles, financial crises, and monetary shifts.
↓ Jump to insight
From 1992 to 2025, $100 invested in gold grew to about $1,220, while the same amount invested in the S&P 500 grew to about $3,190.
↓ Jump to insight
Central banks purchased over 1,045 metric tons of gold in 2024, marking the third straight year of heavy reserve accumulation.
↓ Jump to insight
Gold Performance and Returns
In early 2021, gold traded near $1,800 per ounce. By early 2026, prices had risen above $4,000 per ounce. This increase did not happen evenly. Prices moved through repeated spikes, pullbacks, and consolidation periods over time.
Over the past year, the price of gold rose by about 65%. At the start of January 2026, gold traded near $4,320 per ounce. Within three weeks, prices climbed by about 12% and reached new record levels above $4,800 per ounce.
Long-Term Returns
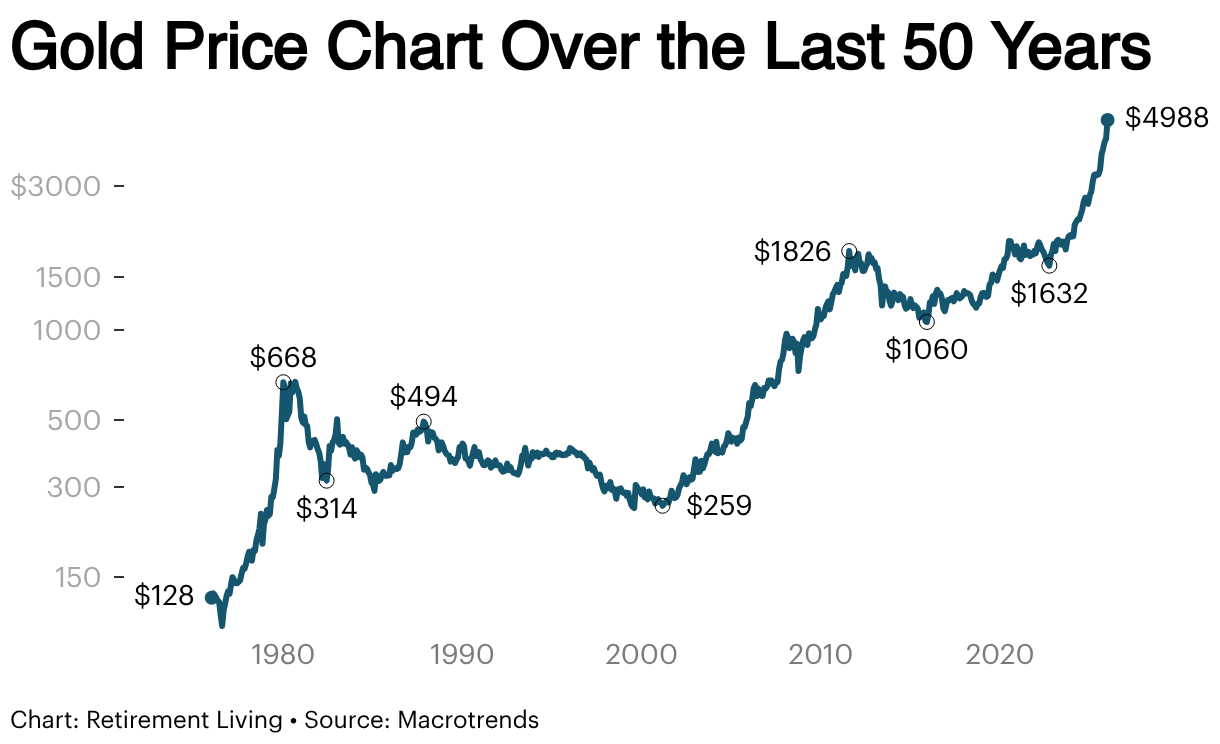
Historical gold prices show an increase of about 23,000% over the past century, rising from roughly $20.72 per ounce in 1926.
Over long periods, gold delivers lower and more stable returns. Based on gold spot price data, the average annual return was 6.7% over the last 40 years.
Returns increase when the time frame shortens. Gold produced an average annual return of 11.2% over the last 20 years and 15% over the last 10 years.
Inflation-Adjusted Gold Returns
Inflation-adjusted gold prices tend to change during periods of economic stress. Prices rose in the late 1970s after the U.S. ended the gold standard and inflation increased. In 1980, inflation-adjusted gold prices peaked near $2,700 per ounce. As inflation eased and interest rates rose, real gold prices fell and stayed lower through most of the 1980s and 1990s.
Gold prices moved higher again after 2001 following the dot-com crash and the September 11 attacks. Another strong rise took place between 2007 and 2011 during the financial crisis, when problems in the banking system pushed more investors toward gold.
After several years of lower real prices, gold climbed again during the COVID-19 period and the inflation that followed. By January 2026, inflation-adjusted gold prices reached their highest level in the historical data.

Gold Returns Compared to Other Assets
Gold vs. the S&P 500
Over long periods, U.S. stocks have produced higher total returns than gold. From February 1992 to December 2025, a $100 investment in gold grew to about $1,220. Over the same period, $100 invested in the S&P 500 grew to about $3,190.
That relationship shifts during market stress. In the early 2000s, during the 2007 to 2009 financial crisis, and again in 2020, gold prices held steady or rose while stock prices declined.

Gold vs. the U.S. Dollar
Gold is priced globally in U.S. dollars. When the dollar weakens, it takes more dollars to buy the same amount of gold, which pushes gold prices higher. This is why gold is often used to protect purchasing power during periods of inflation.

Gold vs. Silver
Gold and silver often move in the same direction, but silver tends to move more sharply. In January 2026, silver rose above $100 per ounce after spending decades below its 1980 high.
The gold-silver ratio shows how many ounces of silver equal the value of one ounce of gold. Currently, the ratio is about 48 to 1, meaning it takes roughly 48 ounces of silver to match the price of one ounce of gold.
The ratio changes because silver prices rise and fall faster than gold. When silver gains more quickly, the ratio falls. When silver lags behind gold, the ratio rises.

Central Bank and Institutional Gold Activity
Central banks hold gold as part of their reserves to reduce reliance on paper currencies, especially the U.S. dollar, and to protect value during financial stress. Gold does not depend on any single government or financial system, which makes it useful in unstable conditions.
Since 2020, central banks have increased gold buying as inflation rose and global risks became more frequent. In 2024, they purchased more than 1,045 metric tons of gold for the third year in a row. This buying reflects concern about currency stability, interest rate volatility, and geopolitical tension.
That pattern continued into 2025. Metal prices rose as the USD weakened, and central bank purchases remained well above historical averages. According to the World Gold Council, this activity points to a long-term shift in reserve strategy rather than short-term price moves.
Recent purchases came from a wide range of countries, including Poland, Brazil, Kazakhstan, Uzbekistan, China, and Indonesia. The United States still holds the largest gold reserves in the world, now valued at over $1 trillion because of higher prices.
Physical Gold Supply and Mining Statistics
Global gold supply comes from mining and recycling. In 2024, total supply increased slightly, with mine production just under 3,700 tonnes and recycled gold adding a meaningful share.
China was the largest producer in 2024, mining about 380 tonnes, or roughly 10% of global output. Russia, Australia, Canada, and the United States followed, with each producing between 150 and 330 tonnes. Together, these countries accounted for most newly mined gold.
Gold supply grows slowly because mine output changes little year to year. Recycling helps add supply, but it depends on price levels and investor selling, which can vary.

Investment Options & Costs
Physical gold is commonly sold as gold bullion, coins or bars. Gold bars are simple pieces of gold sold by weight and purity, while coins are issued by government mints and are easier for many buyers to recognize and resell. Both are widely used for long-term gold holding.
Gold is priced in troy ounces, which are slightly heavier than regular ounces. One troy ounce equals 31.1 grams. Investment-grade gold is usually 99.5% pure or higher. Some coins contain slightly less gold but are still accepted because they meet official standards.
A Gold IRA lets you hold physical gold inside a retirement account instead of keeping it at home. You buy approved gold through the account, and a licensed custodian stores it in a secure facility while your account keeps the same tax treatment as a traditional or Roth IRA. The IRS limits Gold IRAs to specific coins and bars that are at least 99.5% pure gold.
Storage Requirements & Fees
For a Gold IRA, the IRS requires the gold to be stored in an approved depository. This means the gold is kept in a secure facility rather than at home or in a personal safe deposit box. These facilities specialize in precious metals and protect holdings through insurance and regular audits.
Storage comes with annual fees. Most depositories charge an annual storage fee, either as a percentage of the gold’s value or as a flat rate. Fees typically range from 0.5 to 1% per year, or about $50 to $300 annually, depending on the amount stored and the facility used.
Bottom Line
Gold prices reached record highs in early 2026 after strong gains in 2025, supported by central bank buying and rising private investor demand.
Analysts at Goldman Sachs expect real-time gold prices to reach around $5,400 per ounce by late 2026. Meanwhile, UBS places its outlook closer to $5,000, with higher prices possible during periods of economic or geopolitical uncertainty.
Fair Use Statement
If you’ve recently invested in or traded gold, we’d like to hear from you. Share your experience at [email protected]. Your personal details will remain confidential.
Sources
- World Gold Council. Central Bank Gold Statistics: Buying Momentum Continues Into November. Evaluated January 2026.
Link Here - World Gold Council. Global Mine Production Data.Evaluated January 2026.
Link Here - Goldman Sachs. Gold Price Outlook and 2026 Forecast. Evaluated January 2026.
Link Here - Fortune. U.S. Gold Reserves Hit $1 Trillion in Value After Record Rally. Evaluated January 2026.
Link Here - Business Insider. Americans Barely Own Gold, Goldman Sachs Analysis. Evaluated January 2026.
Link Here - Yahoo Finance. Gold Tops $4,900 as Goldman Sachs Raises Price Forecast. Evaluated January 2026.
Link Here - CNBC. Silver Hits Record High Above $100 as Gold Nears $5,000. Evaluated January 2026.
Link Here