
Retirement Living takes an unbiased approach to our reviews. We may earn money when you click a partner link. Learn More
Social Security Statistics
A data-driven look at average payouts, claiming strategies, and the long-term outlook for Social Security benefits in retirement.
Updated:
At a glance:
- The average Social Security retirement benefit is about $1,840 per month, though payments vary by beneficiary type and earnings history.
- Benefits can increase or decrease depending on when you claim, with early retirement reducing payouts and delaying until age 70 significantly boosting them.
- Social Security replaces only a portion of pre-retirement income and is projected to cover just part of scheduled benefits after 2033 without policy changes.
Key Takeaways:
- Almost 67 million Americans per month receive a Social Security benefit.
- The Social Security Administration pays out $1.4 trillion in benefits each year.
- Twenty-nine percent of people claim Social Security at age 62 (the first year of eligibility).
- The average social security benefit for retired workers is $1,840.27.
- Average monthly payouts have increased 96.2% since 2000; however, inflation has increased by 1.65 times since then, resulting in minimal gains in income.
- Even though Social Security benefits only replace 33% to 55% of earnings for the average worker, Social Security is the largest source of income for most beneficiaries.
- Women earn thousands of dollars less per year in Social Security benefits than men.
- Experts estimate that the Social Security program can be funded in full through 2033. For all years following, retirees will only receive 76% of their scheduled benefits.
Average Social Security Retirement Benefit
According to the most recent data for 2023, the average social security benefit for retired workers is $1,840.27—about 8% more than Social Security recipients as a whole.
Spouses and children also receive benefits, which can increase your total household benefit amount. How much a household member receives depends on the scenario. Spouses and minor children of retired workers, for example, receive a check of about $860 to $900 a month on average.
| Type of Beneficiary | Average Monthly Benefit |
|---|---|
| All Recipients | $1,705.79 |
| Retired Workers | $1,840.27 |
| Disabled Workers | $1,486.83 |
| Survivor Benefits | $1,454.48 |
What Is the Maximum Social Security Check?
If you wait until full retirement age, the maximum Social Security benefit in 2023 is $3,627.
- If you retire at age 62, your maximum benefit decreases to $2,572.
- If you retire at age 70, your maximum benefit increases to $4,555. However, most people will not meet or exceed Social Security’s annual maximum earnings ($160,300 for at least 35 years of work) to qualify for this benefit.
Social Security Trends
The average monthly Social Security payout has increased by 96.2% since 2000.
- In 2000, the average monthly payout was only $844.60 compared to $1,705 for all beneficiaries in 2023. While the payout has nearly doubled, inflation has also increased by 1.65 times since then, resulting in minimal gains.
Between 2000 and 2022, the number of Social Security beneficiaries increased by 45.4%.
- In 2022, there were almost 66 million beneficiaries, compared to 45.4 million in 2000. In the same 22-year span, the total American population has only increased by 19.8%, meaning that the number of Social Security beneficiaries is increasing faster than the American population.
How Long Will Social Security Last?
The program only expects to pay out 100% of intended benefits through 2033.
- Many younger workers worry whether Social Security will be there for them when they retire. However, the Social Security Administration predicts that the recent declines in birth rates may restore the program’s ability to fund the Social Security program in full through 2033. For all years following, retirees will only receive 76% of their scheduled benefits.
- This would represent an immediate $17,400 cut in current dollar annual benefits for a typical dual-income couple retiring in 2033 and a $13,100 cut for a typical single-income couple.
The Gap Between Social Security Reserves vs. Projected Program Income
Social Security’s cash expenses have exceeded its cash receipts since 2010.
- The projected gap between Social Security payouts and the income it receives is 3.61% over the next 75 years, up from 3.42% in 2022. The 2023 Trustees Report moved up the depletion of the Old-Age and Survivors Insurance (OASI) trust fund assets from 2034 to 2033.
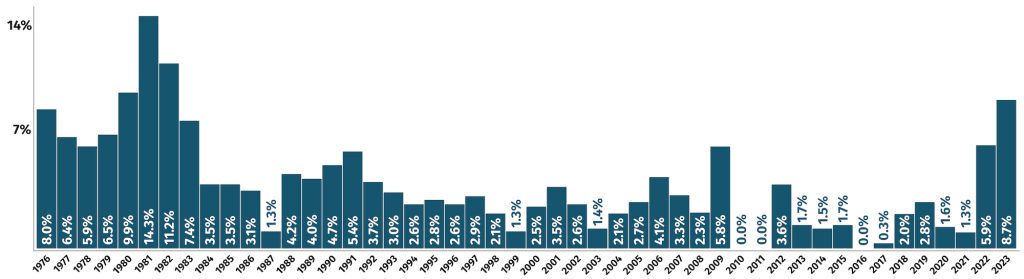
Annual Cost-of-Living Adjustments
The Social Security Administration adjusts the benefit amount according to inflation. The 8.7% increase in 2023 was the highest COLA increase in 40 years. The last time the cost-of-living adjustment was higher was in 1981, when the increase was 11.2%.
The annual COLA doesn’t always correlate perfectly with the annual inflation rate. In 1980, the COLA reached the highest level in history at 14.3%, while the inflation rate was 13.5%. Conversely in 2022, the inflation rate was 8%, which led to a 2023 COLA of 8.7%.
The Effects of Claiming Benefits Early vs. Later
You can start receiving benefits as early as 62, the current early retirement age, but you’ll receive about 25% less each month.
- If you wait until full retirement age, which depends on the year you were born, you’ll receive the full monthly amount.
- If you wait until age 70 to claim social security, you can boost your benefits by 30% or more. You can earn about 8% more for each year you delay your benefits, up until age 70.
Age claiming data by the numbers:
- If you retire at age 62 in 2023, your maximum benefit would be $2,572.
- If you retire at full retirement age in 2023, your maximum benefit would be $3,627.
- If you retire at age 70 in 2023, your maximum benefit would be $4,555.
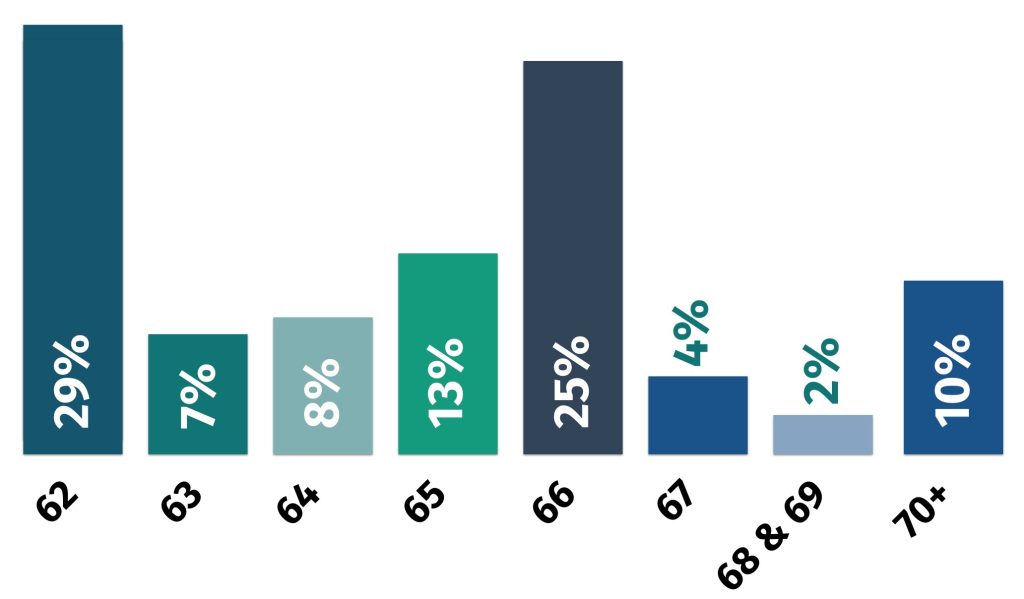
More people (about 29%) claim benefits at age 62, the first year of eligibility. One in four people wait to draw Social Security benefits until age 66.
Social Security Income Replacement Rate
Many Americans rely on Social Security as a main source of income during retirement, but the replacement rates are gradually declining as the program’s full retirement age gradually rose from 65 in 2000 to 67 in 2022.
For someone who worked all of their adult life at average earnings and retires at age 65 in 2022, Social Security benefits will replace about 37% of past earnings. This figure varies widely depending on your lifetime earnings.
- 75.3% replacement for someone with “very low” career earnings ($15,006 per year)
- 54.8% replacement for someone with “low” average earnings ($27,011 per year)
- 40.7% replacement for someone with “medium” average earnings ($60,024 per year)
- 33.6% replacement for someone with “high” average earnings ($96,039 per year)
- 26.7% replacement for someone with “maximum” average earnings ($147,775 per year)
What Percentage of Retirees Live on Social Security?
Despite Social Security replacing only a portion of income during retirement, 40% of older Americans rely only on Social Security income in retirement.
- Without Social Security benefits, about 4 in 10 adults aged 65 and older would have incomes below the poverty line.
- Social Security benefits lift more than 15 million older adults above the poverty line.
How Many People Receive Social Security?
97% of older adults (aged 60 to 89) either receive Social Security or will receive it.
- Nearly 9 out of 10 Americans age 65 and older recieve a Social Security benefit.
- About 3.5% of the total population aged 60 or older never receive Social Security benefits.
Retired workers account for just over 74% (49.4 million) of Social Security beneficiaries, and receive a total of $90.8 billion ($1,837 average monthly benefit).
Women and Social Security
As of June 2023, men received about $1,838 per month on average. In contrast, the average monthly check for women was $1,651 per month—a difference of about $187 per month, or $2,244 per year.
- Because benefits are calculated using your earnings history and time in the workforce, women tend to receive a lower benefit than men.
- In 2021, the median earnings of women aged 15 to 64 who worked full-time for 50 weeks or more, were $50,000, compared to $60,000 for men.
- While more than half (55.2%) of women recieve Social Security benefits, 64% of women will never receive will never these retirement funds. This is known as a “never beneficiary.”
Is Social Security Income Taxable?
Yes, Social Security is taxable at any age. The IRS won’t tax all of your benefits, though. You’ll only pay tax on a percentage of your income (benefits), up to 85%, depending on your filing status.
Depending on where you live, you may pay both federal and state taxes.
| Filing Status | Provisional Income | Taxable Income Rate |
|---|---|---|
| Single or Head of Household | Less than $25,000 | No Tax |
| Single or Head of Household | $25,000 – $34,000 | Up to 50% |
| Single or Head of Household | More than $34,000 | Up to 85% |
| Joint Filers | Less than $32,000 | No Tax |
| Joint Filers | $32,000 – $44,000 | Up to 50% |
| Joint Filers | More than $44,000 | Up to 85% |
11 States That Tax Social Security and the States That Don’t
Though it’s becoming less common, some states still tax Social Security benefits. Here is a state-by-state breakdown of Social Security tax laws.
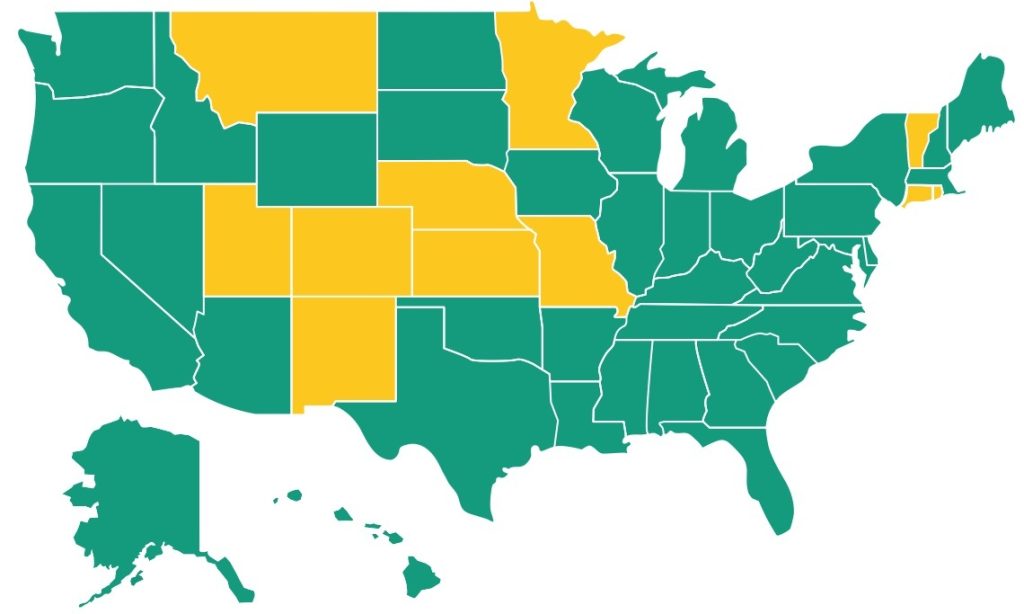
The states that tax Social Security are Colorado, Connecticut, Kansas, Minnesota, Missouri, Montana, Nebraska, New Mexico, Rhode Island, Utah, and Vermont.
Read more: Taxes by State
| State | Social Security Tax | Tax Rate and Available Exemptions |
|---|---|---|
| Alabama | No | No Social Security Tax |
| Alaska | No | No Social Security Tax |
| Arizona | No | No Social Security Tax |
| California | No | No Social Security Tax |
| Colorado | Yes | 4.4%; Retirees under age 65 can deduct up to $20,000 of Social Security benefits from their taxable income (as of 2023). |
| Connecticut | Yes | 3% to 6.99%; Up to 25% of AGI above $75,000 (single filers) or $100,000 (married couples filing jointly). Benefits below these thresholds are exempt. |
| Delaware | No | No Social Security Tax |
| District of Columbia | No | No Social Security Tax |
| Florida | No | No Social Security Tax |
| Georgia | No | No Social Security Tax |
| Hawaii | No | No Social Security Tax |
| Idaho | No | No Social Security Tax |
| Illinois | No | No Social Security Tax |
| Indiana | No | No Social Security Tax |
| Iowa | No | No Social Security Tax |
| Kansas | Yes | 5.7% on all income above $75,000 |
| Kentucky | No | No Social Security Tax |
| Louisiana | No | No Social Security Tax |
| Maine | No | No Social Security Tax |
| Maryland | No | No Social Security Tax |
| Massachusetts | No | No Social Security Tax |
| Michigan | No | No Social Security Tax |
| Minnesota | Yes | 5.35% to 9.85%; Retirees qualify for a Social Security income subtraction up to $5,840 based on income levels. |
| Mississippi | No | No Social Security Tax |
| Missouri | Yes | Up to 5.3% for income exceeding $85,000 ($100,000 for joint filers). All Social Security benefits will be exempt starting in tax year 2024. |
| Montana | Yes | 6.75% for income over 25,000 (single filer) or $32,000 (married filing jointly). |
| Nebraska | Yes | 2.46% to 6.84%; Income greater than $31,160 for single filers ($62,320 for joint filers) is taxed at 6.84%. |
| Nevada | No | No Social Security Tax |
| New Hampshire | No | No Social Security Tax |
| New Jersey | No | No Social Security Tax |
| New Mexico | Yes | 1.7% to 5.9%; Income below $100,000 ($150,000 for joint filers). |
| New York | No | No Social Security Tax |
| North Carolina | No | No Social Security Tax |
| North Dakota | No | No Social Security Tax |
| Ohio | No | No Social Security Tax |
| Oklahoma | No | No Social Security Tax |
| Oregon | No | No Social Security Tax |
| Pennsylvania | No | No Social Security Tax |
| Rhode Island | Yes | Up to 5.99% on income greater than $95,000 for single filers and $119,750 for joint filers. Those who are of full retirement age earn additional exemptions. |
| South Carolina | No | No Social Security Tax |
| South Dakota | No | No Social Security Tax |
| Tennessee | No | No Social Security Tax |
| Texas | No | No Social Security Tax |
| Utah | Yes | Social Security credit up to $450 if you don’t claim the Retirement Credit |
| Vermont | Yes | 3.35% to 8.75%; Total or partial exemptions for income less than $60,000 ($75,000 for joint filers). |
| Virginia | No | No Social Security Tax |
| Washington | No | No Social Security Tax |
| West Virginia | No | No Social Security Tax |
| Wisconsin | No | No Social Security Tax |
| Wyoming | No | No Social Security Tax |
Sources:
- The Center on Budget and Policy Priorities: Facts About Social Security. Accessed August, 31, 2023.
- The U.S. Social Security Administration: Fact Sheets, Benefits Paid by Beneficiary, Never Beneficiaries, and press releases. Accessed August 31, 2023.
- Center for Retirement Research at Boston College: Social Security’s Financial Outlook: The 2023 Update in Perspective. Accessed August 30, 2023.
- Congressional Research Service: The Social Security Retirement Age: An Overview. Accessed September 6, 2023.
- Congressional Research Service: Social Security: The Trust Funds. Accessed September 6, 2023.
- Committee for a Responsible Federal Budget: U.S. Budget Watch 2024. Accessed September 6, 2023.